
Stop Guessing, Start Winning
You’re losing money because you’re fighting the trend. You’re trying to buy at the bottom and sell at the top, and you’re getting slaughtered. The market has a dominant direction, and your only job is to get on the right side of it. The problem is, you don’t know how to read it. Forget the guesswork. We’re going to show you a simple, powerful, multi-indicator system on how to identify market trends with a high degree of accuracy. This isn’t just about one indicator; it’s about building a confluence of evidence that gives you an undeniable edge. Let’s get to it.
The Problem with a Single Indicator
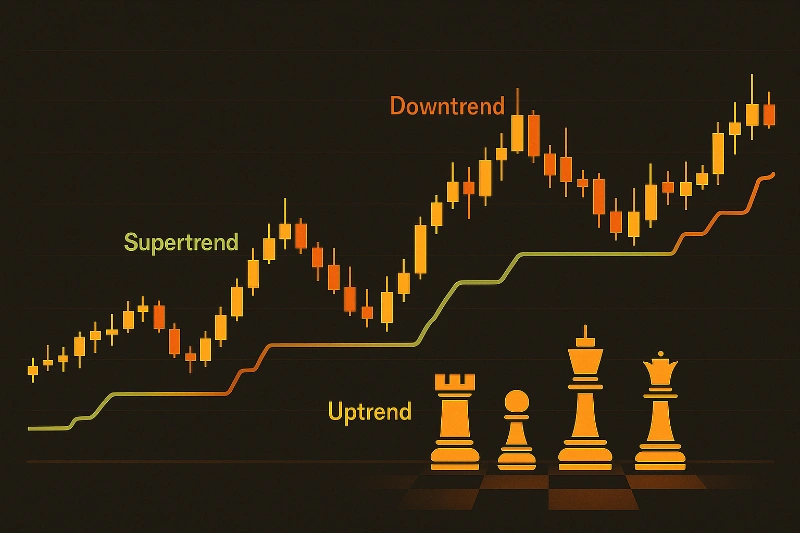
The Super Trend indicator is great. It’s simple: green means buy, red means sell. It’s excellent at catching momentum when the market is trending hard. But it has a fatal flaw: it gives you constant, money-losing false signals when the market is moving sideways. A choppy, range-bound market will flash buy, sell, buy, sell, chopping up your account with a death by a thousand cuts. An indicator in isolation is a recipe for disaster. We need filters. We need a system.
Strategy 1: The Triple Super Trend Filter
This is how you filter out the chop. Instead of one Super Trend, you put three on your chart with different settings (12,3), (10,1), and (11,2). This creates a three-layered filter. The rule is simple and non-negotiable: you only enter a long trade when *all three* Super Trend lines are green. You only enter a short trade when *all three* are red. If there’s a mix of colors, it means the market is in a state of indecision and chop. You sit on your hands and wait. This simple system of agreement forces you to only trade when there is a strong, confirmed consensus of momentum across multiple settings.
Strategy 2: The 200 EMA and Super Trend Combo
This is the classic professional approach. We combine a short-term trend indicator (Super Trend) with a long-term trend indicator (the 200-period EMA). The 200 EMA is the institutional line in the sand. If the price is above it, the long-term trend is up. If it’s below, the long-term trend is down. Our strategy now has two rules: 1. For a long trade, the price must be *above* the 200 EMA, AND the Super Trend line must be green. 2. For a short trade, the price must be *below* the 200 EMA, AND the Super Trend line must be red. This powerful combination ensures you are only taking short-term momentum signals that are in alignment with the dominant, long-term market current. This is how you stop fighting the tide and start surfing it.
Automate your trading with proven logic and skip the years of trial and error.
Our The Ultimate 100 Trading Strategies includes a ready-to-run algorithm plus the guide to master it.
Plug it in. Let it work. Watch results speak.
Strategy 3: The Ichimoku Cloud and Super Trend
The Ichimoku Cloud is another powerful tool for identifying trend and momentum. For our purposes, we simplify it. The ‘Kumo Cloud’ acts as a dynamic zone of support and resistance. The rule is similar to the 200 EMA strategy: 1. For a long trade, the price must be *above* the Kumo Cloud, AND the Super Trend line must be green. 2. For a short trade, the price must be *below* the Kumo Cloud, AND the Super Trend must be red. If the price is inside the cloud, it’s a zone of uncertainty and chop—no trades. This strategy gives you a clear visual guide to the trend and helps you avoid getting caught in messy, unpredictable price action.
Build a System, Not a Signal
The key takeaway on how to identify market trends is that you need a system, not just a single signal. By combining indicators like the Super Trend with a long-term filter like the 200 EMA or the Ichimoku Cloud, you create a robust process for decision-making. You force yourself to trade only when multiple, independent factors are aligned in your favor. This is what it means to trade with a statistical edge. Stop looking for a magic bullet indicator and start building a professional-grade system. That’s how you win.
Why Trade with a Bot?
Because a multi-indicator system requires constant monitoring and flawless execution. A bot can watch the 200 EMA, the Ichimoku Cloud, and the Super Trend across dozens of markets simultaneously. It can execute a trade based on our The Ultimate 100 Trading Strategies the microsecond all your rules are met. It never gets tired, it never hesitates, and it never breaks the rules. Stop being the weakest link in your system. Click the damn link.
Why Use Our Recommended Broker?
A trend-following strategy is only as good as its execution. Slippage and slow fills will kill your profits. We recommend Tickmill for their institutional-grade speed and reliability. When your system gives you a signal, you need a broker that can execute without fail. Get a professional setup.
Recommended Video:

