
Introduction: The MACD is Your False Breakout Filter
You’re getting chopped to pieces by false breakouts. You see a stock moving, you jump in, and it immediately reverses. It’s a classic amateur mistake. You need a better filter. The MACD (Moving Average Convergence Divergence) is that filter. When used correctly, it is a powerful tool that helps you trade on the ‘front side’ of a move—where the real momentum is—and avoid overtrading the congested, choppy ‘back side.’ This is a step-by-step guide on how to use the MACD indicator to stay on the right side of the trade and protect your capital. Let’s get into it.
The Basics: What the MACD Actually Measures
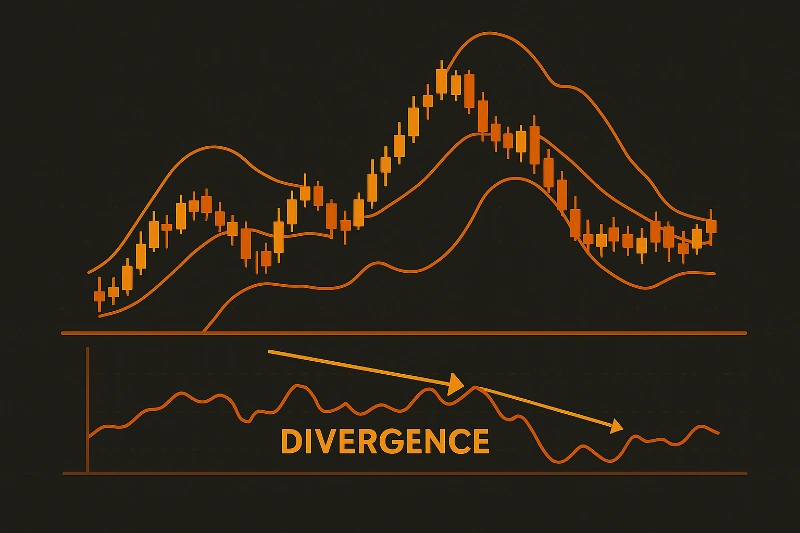
The MACD is simpler than it sounds. It measures the relationship between two exponential moving averages (EMAs), typically the 12-period and 26-period. When these moving averages are moving apart (diverging), it signals increasing momentum. When they are coming together (converging), it signals decreasing momentum. The MACD histogram visualizes this convergence and divergence. The key signal for our purposes is the **MACD crossover**: when the MACD line crosses above its signal line, it’s a bullish signal. When it crosses below, it’s bearish. We use the standard, default settings (12, 26, 9) because that’s what the rest of the market is watching. Don’t try to be a hero with custom settings; you’ll only be seeing a signal no one else sees.
The Strategy: Trading the Front Side of the Move
The highest probability trades occur at the beginning of a new momentum move. We call this the ‘front side.’ This is where the big, clean price action happens. The ‘back side’ is after the initial move has exhausted itself, and the price action becomes choppy and unpredictable. This is where amateurs give back all their profits. The MACD is our guide to distinguishing between the two. **The Rule:** We only take trades when the MACD is ‘open’ and in favor of our trade direction. For a long trade, the MACD line must be above the signal line. If it crosses below, we are no longer interested in buying. We wait. This simple rule keeps you out of the chop and forces you to focus only on high-momentum setups.
Case Study: A $5,000 Trade
Let’s look at a real-world example. A stock has breaking news and spikes hard. The MACD is wide open, showing massive divergence and bullish momentum. It pulls back, but the MACD remains open in our favor. This is a high-probability dip buy on the front side of the move. We get in, and ride the next leg up. Then, the price starts to get choppy and pulls back harder. We see the MACD line begin to converge with the signal line, and then it crosses below. **This is our signal to walk away.** The front side of the move is over. From this point on, we do not take any more long trades, even if the price pops up. We wait for the MACD to reset and give us another clean, open crossover. This discipline—knowing when to walk away—is what separates pros from the herd who overtrade the back side and bleed their accounts dry.
Automate your trading with proven logic and skip the years of trial and error.
Our The Ultimate 100 Trading Strategies includes a ready-to-run algorithm plus the guide to master it.
Plug it in. Let it work. Watch results speak.
Why This Works: Avoiding False Breakouts
How does this help you avoid false breakouts? Imagine a stock is consolidating and trying to break out to a new high. As a beginner, you might buy the second it pops its head above resistance. But if you look at your MACD and see that it’s still crossed down (bearish), you have a conflict. The price is saying one thing, and the momentum indicator is saying another. This is a massive red flag. This is how you identify a potential false breakout *before* it traps you. You wait for the price breakout to be *confirmed* by a bullish MACD crossover. When price and momentum align, your probability of success skyrockets.
Conclusion: Your Momentum Compass
Stop trading on price alone. You need a compass to navigate the market’s momentum, and the MACD is one of the best there is. Use it as a filter. Use it to confirm your trade ideas. Most importantly, use it to know when to stay out of the market. Mastering how to use the MACD indicator is about adding a layer of objective, momentum-based analysis to your trading. It’s a tool for patience and precision. Add it to your arsenal, and stop getting caught on the wrong side of the move.
Why Trade with a Bot?
Because the MACD strategy requires you to monitor for a specific confluence of events—a price pattern combined with a momentum crossover. A trading bot can do this for you 24/7. It can be programmed with our The Ultimate 100 Trading Strategies to only take trades when the MACD is in your favor, enforcing the discipline that you will inevitably struggle with. Stop making emotional mistakes. Click the damn link.
Why Use Our Recommended Broker?
This strategy relies on capturing moves when momentum is strong. You need a broker that can keep up. A slow platform with high spreads will cause you to miss the best part of the move. We recommend Tickmill for their high-speed execution and professional-grade platform. Don’t let your broker be the weak link. Get a real account.
Recommended Video:


